Bioinformatics Made Easy
Discover the future of bioinformatics with our cutting-edge HTML-based tools designed to enhance research efficiency and accelerate scientific breakthroughs.
Sequora DNA
Sequora Phylogenomics - Small Genome Comparison Made Easy
(Under Extended Testing)
©2025, 2026 Gregory S Muhs, All Rights Reserved
Release 4-14 - 03 August 2026 - Continuing Easy Button pipeline and individual-components mode integration.
Release 4-12 - 03 August 2026 - Reintegrating Easy Button pipeline mode along with individual-components mode.
Release 4-01 - 28 July 2026 (Build Date) - A new release that incorporates a full pipeline "Easy Button" and refines minor bugs (such as early termination). The new "MARS" metric is now included in this new release.
Release 3.18 - 26 December 2025 - Fixed a bug in Part 4A, which caused inflated similarities
Welcome to Sequora!
The purpose of this project is to make Bioinformatics easy, visually appealing, and enjoyable for scientists from any specialty, especially those who do not have a background in computer programming. My philosophy is that science should be fun, even for career scientists.
My premier tool is the following Sequora Small Genome Phylogenomic comparison tool. This tool is web-based, meaning no complex software downloads are required. It has been shown to compare 6 to 12 bacterial genomes within hours, by comparing "chunks" between each pair of genomes, and ultimately creates phylogenomic trees .
My hope is that this tool can help both myself and other scientists to accelerate our research, further our understanding of the natural world, and ultimately lead to better tools and better science later on down the road.
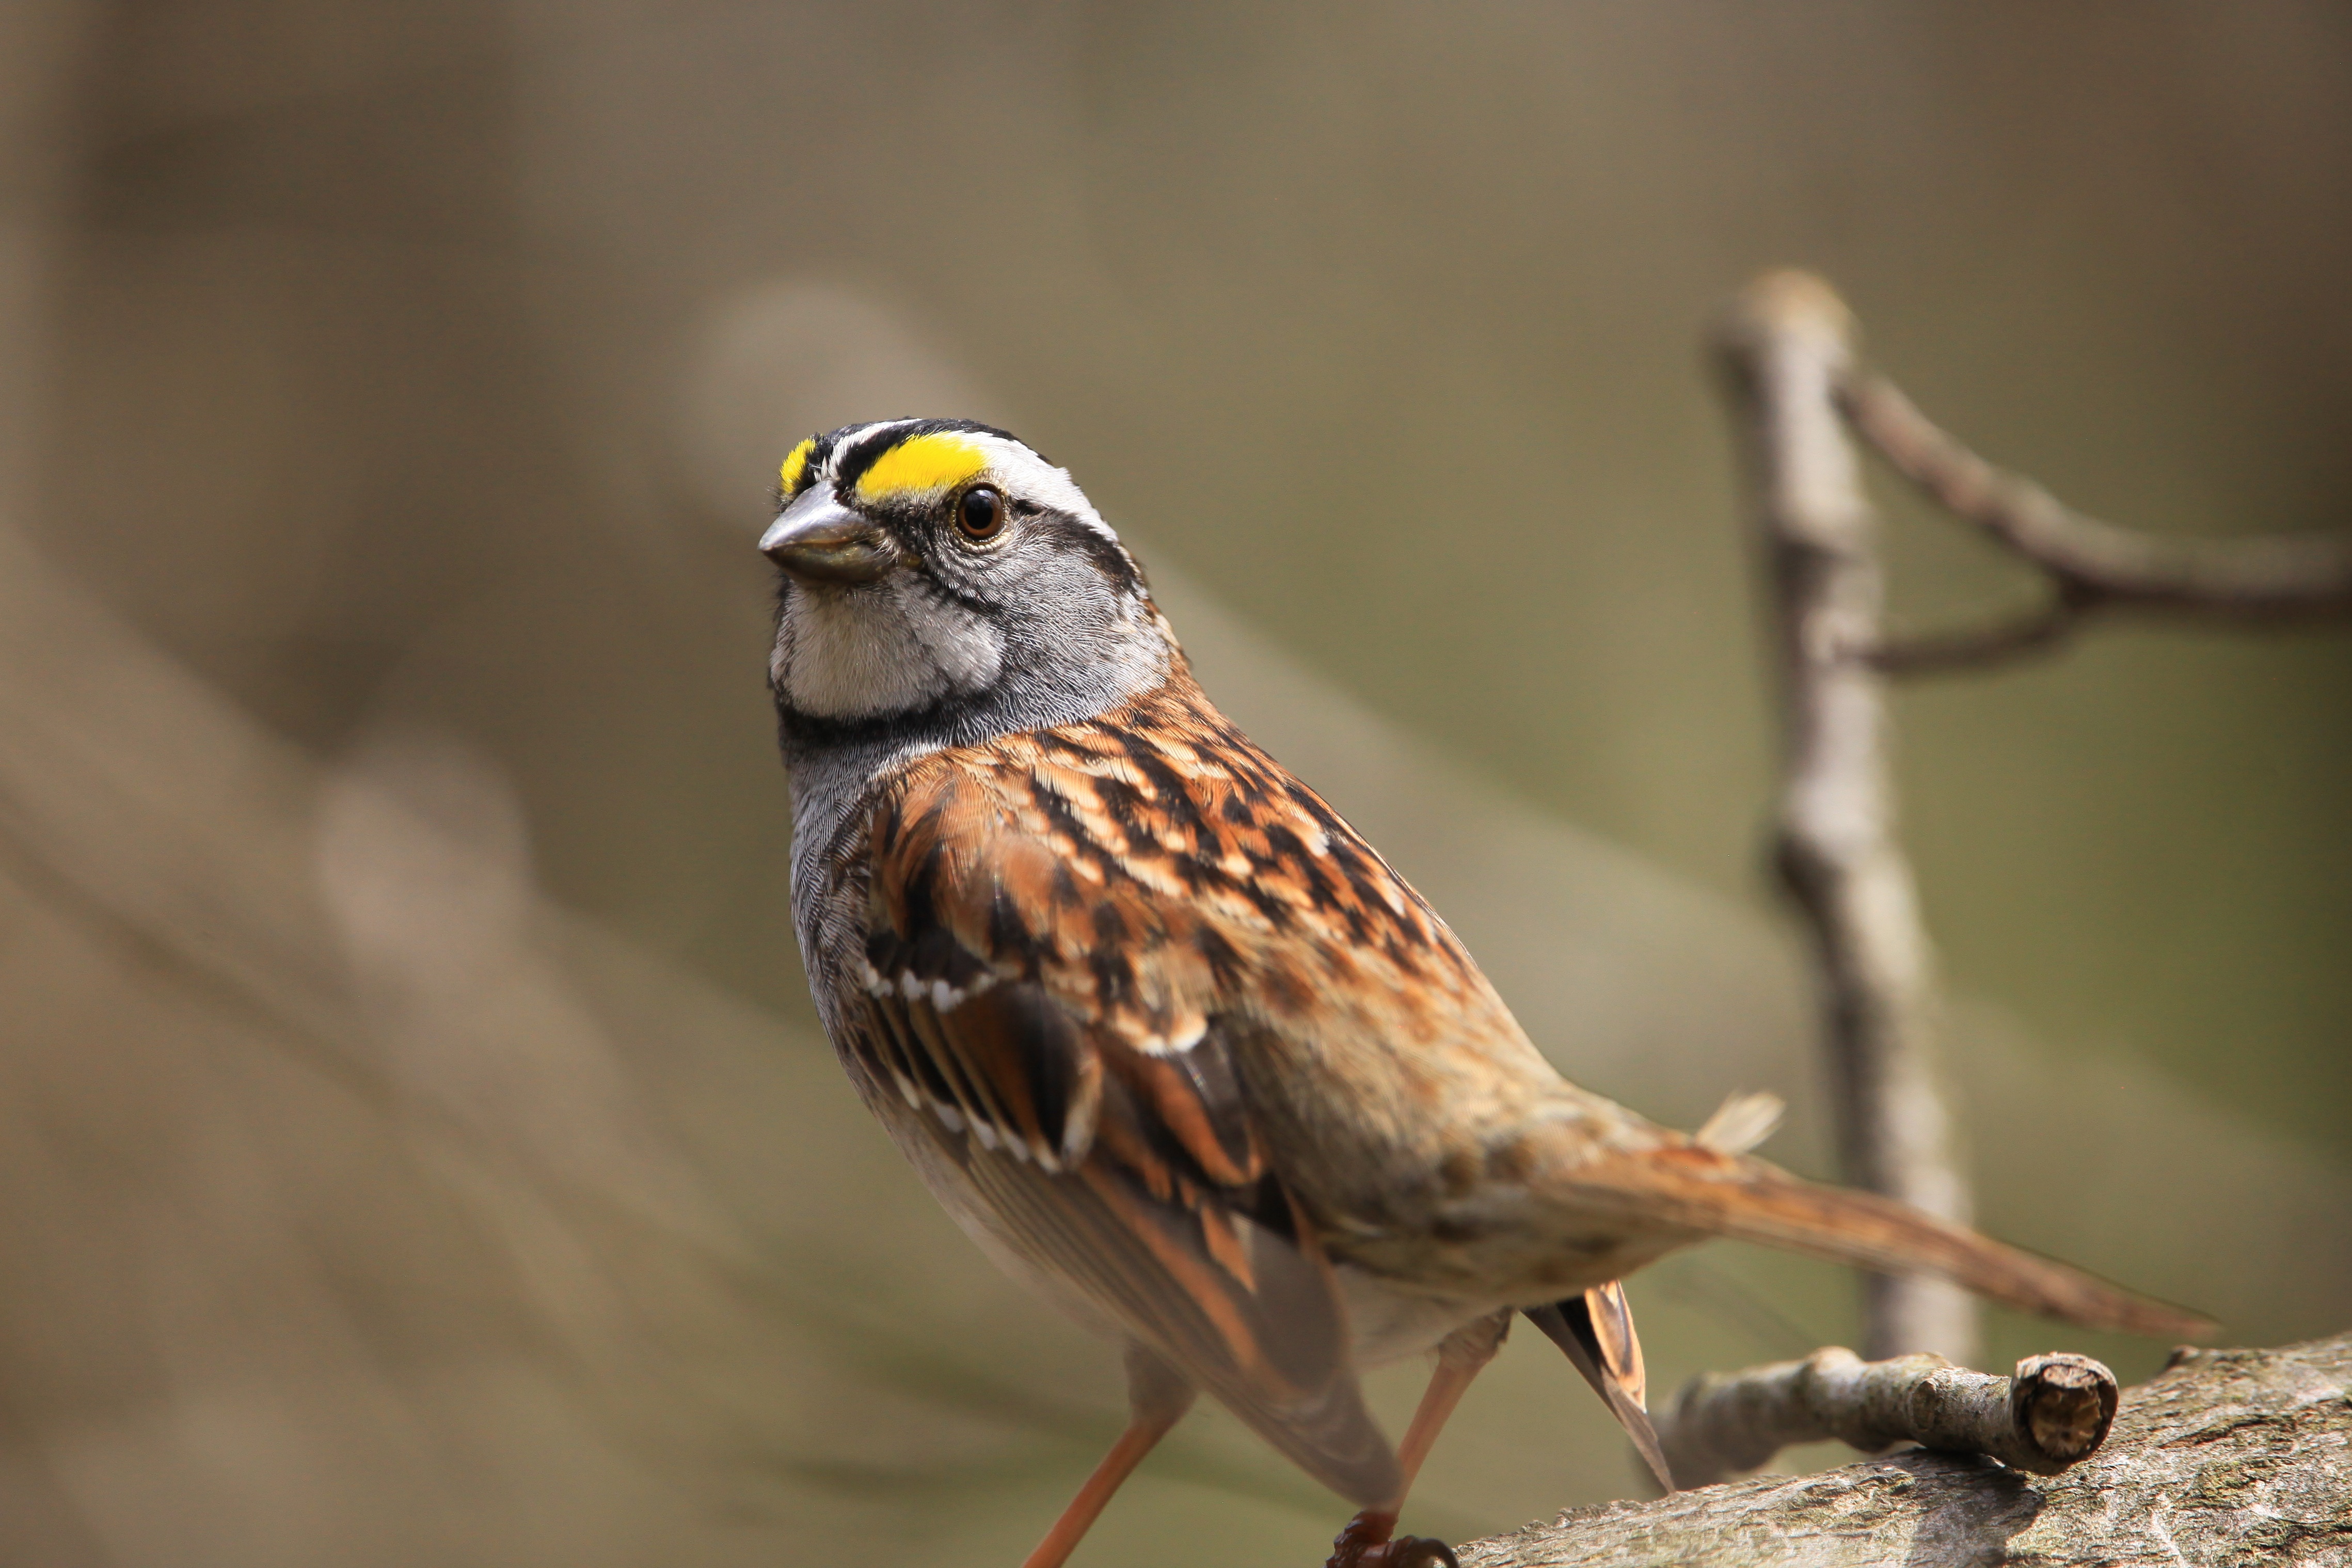
The name Sequora comes from a Cherokee name meaning sparrow, and Matthew 10:29-31 which reads: Are not two sparrows sold for a penny? And not one of them will fall to the ground apart from your Father. But even the hairs of your head are all numbered. Fear not, therefore; you are of more value than many sparrows. (ESV Translation)
Tutorial
Sequora 4-16 Prokaryotic Genome Alignment (Under Construction And Extensive Testing)
Small Genomes Pipeline Web App
Version 4-16 — Clear Stage File Names
Processor & Web Worker Setup
Detected automatically when Sequora loads. A Web Worker is a browser background worker, not a physical CPU core.
Automatic is recommended for most users. Higher counts can increase memory pressure. Changes made during an active Part 3 run apply to the next run.
Analysis settings
Version 4-16: The Easy Button and Individual Parts tabs continue to call the exact same shared stage functions. This build changes only user-facing export names, handoff labels, and file-selection guidance. Scientific calculations, CSV contents, FASTA contents, large-file processing, and report calculations remain preserved. Legacy filenames and generic stage-manifest files remain accepted by content and internal stage metadata.
The legacy placeholder is inserted only for matrix completion and is recorded in the report. It is never treated as a measured biological distance.
The reciprocal-direction, similarity-network nearest-extension, and exact-zero controls affect Parts 6–7 presentation and matrix construction; they do not rerun the underlying Part 3 alignments.
Part 6–7 metrics included in the complete report
All ten recommended Desktop/Web metrics are selected by default. MARS Distance is listed first. Version 4.04 restores the traditional Sequora phylogenomics web: the Neighbor-Joining tree is drawn inside a circular all-measured-pairwise web, and pairwise line colors match the numerical matrix. The Complementary Similarity Network remains a separate force-directed summary.
Part 3: K-mer Filter vs Pairwise Alignment
Live workload accounting for the complete analysis.
Part 3 Performance & Memory
CPU-aware workers, bounded adaptive batches, disk-first result storage, and live scheduler health.
Large chromosome-scale runs require IndexedDB storage so completed batches do not accumulate in active memory.
Run an Individual Pipeline Part
The Easy Button and Individual Parts tabs call the exact same shared stage functions. Only the input adapter differs: the Easy Button receives the previous stage output, while Individual Parts accepts the equivalent uploaded file.
query_chunk_count.csv. Part 5 needs genome_lengths.csv. Handoff files now have short stage-specific names such as part4a_handoff.json, so they cannot be confused with technical run records. Older Sequora_Stage_Manifest.json files remain accepted when their internal stage is compatible.Individual Part Status
Generated files
Parts 1–2 — Genome preparation
Use the Query and Reference FASTA files in the shared setup above.
Main outputs: processed_query.fasta, processed_reference.fasta, query_chunk_count.csv, genome_lengths.csv, and part1-2_handoff.json.
Part 3 — K-mer filtering and Smith–Waterman alignment
Part 4A — Highest scores
Part 4B — Chunk and uniqueness processing
Part 5 — Averages and MARS
Upload a compatible Part 4B handoff or enter and confirm the original Part 3 Match Score.
Parts 6–7 — Rooted and unrooted trees, phylogenomics webs, complementary networks, combined matrices, and unified reports
Results Explorer
No completed project yet.
Individual technical outputs
Validation and Run Log
Sequora Small Genomes Pipeline · Version 4 Guide
What Each Part of Sequora Does
This guide starts with the basic idea behind each stage, then keeps the exact formulas and implementation details available for readers who need them.
STARTThe Easy Button and Complete Analysis Available
What happens when you press the Easy Button?
Typical comparison
Upload the same multi-record FASTA collection as both Query and Reference when comparing every genome in the collection against the others.
Directional comparison
Use different Query and Reference collections when the research question calls for unequal or directional comparisons.
Progress
The main screen reports stage status, planned pairs, k-mer-passed pairs, filtered pairs, completed alignments, warnings, failures, and elapsed time.
Primary downloads
The preferred outputs are one interactive HTML report, one combined PDF report, and one project ZIP containing the scientific and technical files.
Technical details
The Easy Button and the independent-part controls call the same stage functions. This avoids maintaining a second scientific implementation for the automatic workflow.
The current Version 4.02 beta runs in the browser and does not require genome sequences to be sent to a Sequora server. Users should still follow their institution’s rules for handling sensitive or restricted data.
1–2Preparing the Genome Sequences Available
Parts 1–2 prepare the sequence files
What you provide
Query FASTA files, Reference FASTA files, chunk sizes, circular-genome settings, and whether Reference reverse complements should be included.
What Sequora does
Checks the FASTA records, gives duplicate headers distinct labels, divides Query genomes into small pieces, and builds larger searchable Reference records.
Why it matters
Local alignment of whole genomes all at once is expensive. Smaller Query pieces make the search practical while preserving the original genome and chunk identity.
What you receive
Processed FASTA files, Query-chunk counts, genome lengths, record manifests, duplicate-header records, and a Parts 1–2 manifest.
Technical details
- The recommended baseline uses 1,000-base Query chunks and 10,000-base Reference chunks.
- Neighboring Reference chunks are concatenated into larger searchable records. This is different from describing the References as having a fixed 1,000-base overlap.
- For legacy 3-20 circular handling, Sequora builds an additional record from the final two Reference chunks followed by the first chunk.
- Version 4 also supports a boundary-window construction as an alternative circular mode.
- Reference records are accompanied by full IUPAC reverse complements.
3Finding Promising Matches and Aligning Them Matched Desktop on validation fixtures
Part 3 screens and aligns sequence pairs
Planned pairs
Every possible Query-chunk × Reference-record comparison before any filtering occurs.
K-mer passed
Pairs with enough matching short sequence words to be sent to the more expensive alignment calculation.
Filtered out
Pairs that did not meet the selected k-mer threshold and therefore were not aligned.
Pairwise aligned
Passing pairs successfully processed by affine-gap Smith–Waterman and written to the Part 3 table.
For each completed alignment, Sequora records the local-alignment score, aligned length, identity with and without gaps, gap count, and the Query and Reference labels.
Technical details
- The current Version 4.02 beta collects distinct, non-overlapping Query k-mers starting at the first base of each Query chunk.
- It compares them with distinct, overlapping Reference k-mers beginning at every possible Reference position.
- The k-mer score is the percentage of distinct Query k-mers found in the Reference record.
- Repeated copies of the same k-mer are counted once in the current validated implementation.
- IUPAC symbols are treated as literal sequence symbols during k-mer matching and alignment; they are not expanded into sets of possible bases.
- Passing pairs use local affine-gap Smith–Waterman with the selected match, mismatch, gap-open, and gap-extension scores.
The Version 4 engine has been regression-tested against the validated Desktop Part 3 implementation for alignment results and k-mer filter decisions on the tested fixtures.
4AKeeping the Best Alignment Result for Each Query Chunk Available
Part 4A keeps the strongest chunk-level result
What goes in
The complete Part 3 alignment-results table.
What happens
Sequora groups rows by individual Query Label and original Reference genome, finds the highest score, and keeps every row tied for that score.
High Score Count
The number of processed Reference records tied for the winning score. Ties may result from overlapping or circular Reference constructions.
What comes out
A smaller Part 4A table containing the winning chunk-level evidence and its associated alignment measurements.
Technical details
Reference labels are cleaned back to their original genome identity before grouping, while the full Query chunk label is retained. Every row tied at the maximum score is preserved so later stages can trace exactly which processed Reference records contributed.
4BCounting Aligned and Unmatched Query Chunks Available
Part 4B counts how much of the Query produced a qualifying match
Total Query Chunks
The number of chunks created from the Query genome in Parts 1–2.
Aligned
The number of distinct Query chunks that produced qualifying winning evidence against that Reference genome.
Unique
Total Query Chunks minus Aligned. These chunks did not produce qualifying evidence for that genome pair under the selected settings.
What comes out
The Part 4A measurements plus total, aligned, unique, and unique-frequency fields.
Technical details
Version 4 validates that Aligned is a non-negative integer, that a Query chunk count exists, and that Aligned cannot exceed Total Query Chunks. Invalid accounting stops the stage rather than producing a misleading value.
5Turning Chunk Results into Genome-to-Genome Metrics Validation continuing
Part 5 summarizes the comparison at the genome level
What happens
Sequora averages the selected chunk-level measurements for each directional Query-genome → Reference-genome pair.
Coverage matters
Aligned and Unique frequencies help distinguish a strong match across much of a genome from a strong match involving only a small part.
MARS
MARS combines cumulative alignment evidence from both directions and normalizes it using the original genome lengths.
What comes out
Directional genome-pair averages, distance fields, Combined Metrics, cumulative scores, reciprocal checks, MARS, and MARS Distance where available.
Technical details and formulas
Many legacy distance columns use the form (1 − observed value ÷ largest observed value in that run) × 100. Because this normalization depends on the current collection, the same genome pair can receive a somewhat different normalized legacy distance when analyzed within a different group of genomes.
Version 4 places MARS Distance before Combined Metric 1 in metric discovery and reports.
These formulas describe how the current code transforms the measured alignment results. They do not convert sequence difference into elapsed time or identify a historical ancestor.
6–7Building Matrices, Trees, Networks, Heatmaps, and Reports Core available
Parts 6–7 organize the measured distances
Matrix
Sequora turns directional genome-pair values into a symmetric distance table suitable for tree and network methods.
Current visualizations
Version 4.02 provides rooted, unrooted, and circular Neighbor-Joining trees; full and nearest-K phylogenomics webs; a separate Complementary Similarity Network; heatmaps; numerical matrices; leaf legends; Newick; SVG; and tree-fit diagnostics for each selected metric.
Unified reports
The preferred output is one interactive HTML report and one combined PDF report rather than forcing users to open many separate metric files.
Technical access
Separate matrices, trees, diagrams, and underlying files remain available inside the project ZIP.
Technical details
- When A→B and B→A are both available, the current matrix uses their average.
- When only one direction is available, the recommended setting uses that measured direction and counts the pair as single-direction. An advanced strict reciprocal option is also available.
- When neither direction is available, the selected missing-distance policy determines whether a recorded placeholder is inserted or the stage stops.
- Changing a display root in a future build will not change the distance matrix or the underlying unrooted topology.
Phylogenomics webs and complementary network language
DATAMissing Measurements and Placeholder Values Recorded
When a distance is missing
Missing does not mean identical
A missing pair has no usable measured directional distance under the settings and outputs available for that metric.
Legacy-compatible mode
The current placeholder equals 110% of the largest measured distance for that metric.
Strict mode
No placeholder is inserted. Sequora reports the pair and stops visualizations that require a complete matrix.
Transparency
Every substitution is written to Missing_Distance_Substitutions.csv and counted in the report.
Technical details
The placeholder is computed independently for each metric as 1.10 × the largest real, finite symmetric distance observed for that metric. When no positive measured value exists, the present implementation uses a fallback value of 1.
FILESReports, Technical Outputs, and Reproducibility Available
What most users should download
Interactive HTML
A self-contained report for moving between selected metrics and viewing trees, networks, heatmaps, matrices, parameters, and warnings.
Combined PDF
A single printable visual report containing the selected Part 6–7 metric sections. Browser Print → Save as PDF remains a fallback.
Project ZIP
The processed stage FASTA and CSV files, manifests, placeholder records, Newick/SVG outputs, reports, validation information, and run metadata. Keep the original uploaded FASTA files for complete end-to-end reproduction.
Independent outputs
Advanced users can still run and download individual stages without using the Easy Button.
HELPHow to Read Sequora Results Carefully
What Sequora can—and cannot—tell us
- Use trees and networks as visual summaries of measured distances, not as clocks or photographs of history.
- Compare several metrics instead of relying on one tree.
- Check the numerical matrix when a placement looks surprising.
- Review the number of single-direction pairs and placeholder substitutions.
- Consider genome size, orientation, circularity, rearrangement, duplicated sequence, plasmids, horizontal transfer, convergence, and incomplete homology detection.
- Record the exact settings and app version when comparing runs.
- Interpret important findings alongside the sequences themselves, relevant biological knowledge, and complementary established methods.